Multiple Choice
Which graph best describes how the vapor pressure of a solution varies according to Raoult's law as a nonvolatile solute is added to a liquid? The vapor pressure of the solution is plotted on the y-axis, and the mole fraction of solute is plotted on the x-axis. The origin (0, 0) is not necessarily located where the axes cross. 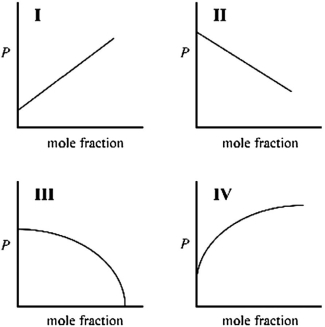
A) I
B) II
C) III
D) IV
Correct Answer:

Verified
Correct Answer:
Verified
Q50: Calculate the molality of a solution containing
Q51: Which of the following would be most
Q52: A 15.0 mg sample of a protein
Q53: The interaction energy of LiF is <font
Q54: Given the same number of moles of
Q56: Indicate which aqueous solution has the highest
Q57: Caryophyllene, a nonelectrolyte, is one of the
Q58: Calculate the minimum pressure that must be
Q59: Calculate the molality of a solution containing
Q60: Which of the following requires the smallest