Multiple Choice
Which graph best describes how the vapor pressure of a solution varies according to Raoult's law as a nonvolatile solute is added to a liquid? The vapor pressure of the solution is plotted on the y-axis, and the mole fraction of solvent is plotted on the x-axis. The origin (0, 0) is not necessarily located where the axes cross. 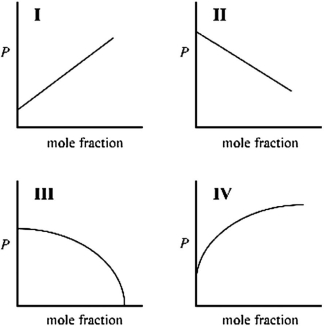
A) I
B) II
C) III
D) IV
Correct Answer:

Verified
Correct Answer:
Verified
Q43: A colligative property does not depend on
Q44: The vapor pressure of an aqueous solution
Q45: Which has the higher vapor pressure at
Q46: Determine the energy change for the reaction
Q47: Write out the steps of the Born-Haber
Q49: Which of the following will have the
Q50: Calculate the molality of a solution containing
Q51: Which of the following would be most
Q52: A 15.0 mg sample of a protein
Q53: The interaction energy of LiF is <font