Essay
The graph below gives distance in miles from a starting point as a function of time in hours for a car on a trip. Find the fastest speed (magnitude of velocity) during the trip. Describe how the speed during the first 2 hours compares to the speed during the last 2 hours. Describe what is happening between 2 and 3 hours. 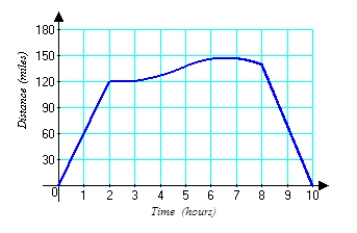
Correct Answer:

Verified
The fastest speed occurred during the la...View Answer
Unlock this answer now
Get Access to more Verified Answers free of charge
Correct Answer:
Verified
View Answer
Unlock this answer now
Get Access to more Verified Answers free of charge
Q14: Find the derivative of <img src="https://d2lvgg3v3hfg70.cloudfront.net/TB2342/.jpg" alt="Find
Q15: Find the derivative of the function. <img
Q16: Find a function with the given derivative.
Q17: Differentiate the function. <img src="https://d2lvgg3v3hfg70.cloudfront.net/TB2342/.jpg" alt="Differentiate the
Q18: Use the position function <img src="https://d2lvgg3v3hfg70.cloudfront.net/TB2342/.jpg" alt="Use
Q20: The table below gives the position s(t)
Q21: Find the derivative of <img src="https://d2lvgg3v3hfg70.cloudfront.net/TB2342/.jpg" alt="Find
Q22: Given that <img src="https://d2lvgg3v3hfg70.cloudfront.net/TB2342/.jpg" alt="Given that
Q23: Differentiate the function. <img src="https://d2lvgg3v3hfg70.cloudfront.net/TB2342/.jpg" alt="Differentiate the
Q24: Find the derivative <img src="https://d2lvgg3v3hfg70.cloudfront.net/TB2342/.jpg" alt="Find the