Multiple Choice
The question refers to the following table, which compares the percent sequence homology of four different parts (two introns and two exons) of a gene that is found in five different eukaryotic species. Each part is numbered to indicate its distance from the promoter (for example, Intron I is the one closest to the promoter) . The data reported for species A were obtained by comparing DNA from one member of species A to another member of species A.
% Sequence Homology
-Based on the tabular data, and assuming that time advances vertically, which phylogenetic tree is the most likely depiction of the evolutionary relationships among these five species?
A) 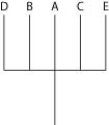
B) 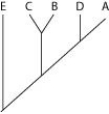
C) 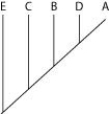
D) 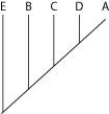
Correct Answer:

Verified
Correct Answer:
Verified
Q14: Imagine that you discovered the following
Q30: Some beetles and flies have antler-like structures
Q33: Which of the following pairs are the
Q36: <img src="https://d2lvgg3v3hfg70.cloudfront.net/TB6149/.jpg" alt=" In the above
Q38: Which statement represents the best explanation for
Q42: <img src="https://d2lvgg3v3hfg70.cloudfront.net/TB6149/.jpg" alt=" Humans, chimpanzees, gorillas,
Q46: If, someday, an archaean cell is discovered
Q46: Which of the following would be most
Q49: To apply parsimony to constructing a phylogenetic
Q67: Concerning growth in genome size over evolutionary