Essay
The graph below is the Keeling Curve,a record of carbon dioxide measured at Mauna Loa beginning in 1958.What can be learned from this graph? What do the two lines (black and grey)tell us? 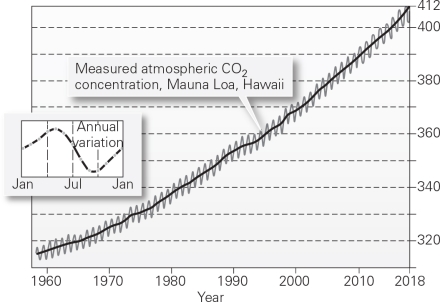
Correct Answer:

Verified
Correct Answer:
Verified
Related Questions
Q1: Increasing ratios of oxygen-18 to oxygen-16 in
Q3: The figure below shows parts of the
Q4: Milankovitch cycles describe variation in the Earth's
Q5: What is a biogeochemical cycle? Provide an
Q6: Models used by the Intergovernmental Panel on
Q7: Identify five probable outcomes of global climate
Q8: The hydrologic cycle includes which of these?<br>A)
Q9: The figure below shows changes in sea
Q10: How are greenhouse gases like carbon dioxide
Q11: Compare and contrast unidirectional change with cyclic