Multiple Choice
The figure below shows the hypsometric curve for the Earth.Which of the following can be concluded from the plot of this data? 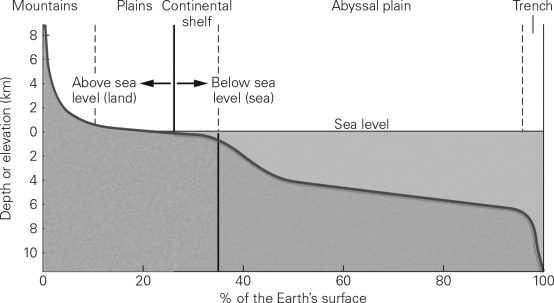
A) Regions of high elevation (> 4 km) are common on the Earth.
B) Most of the continents are between 0 and 1 km above sea level.
C) Elevations of -10 km to 8 km are nearly uniformly distributed across the Earth's surface.
D) Most of the seafloor is more than 6 km below sea level.
Correct Answer:

Verified
Correct Answer:
Verified
Q7: The lithosphere is composed of the<br>A) crust
Q8: The densest layer of the Earth is
Q9: An aurora (shown below)is produced when <img
Q10: From left to right,correctly label each section
Q11: What is a melt? What type of
Q13: The most common minerals within the Earth
Q14: Most meteorites are asteroidal or planetary fragments.As
Q15: Which planets lie within the habitable zone
Q16: Neil Armstrong and Buzz Aldrin were the
Q17: Look at the following image of our