Multiple Choice
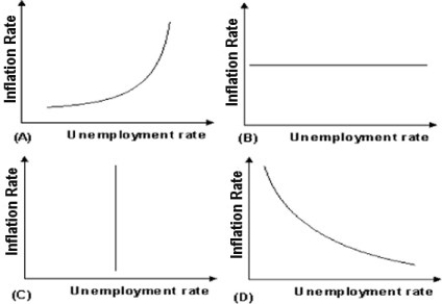
-Use the above figure. Graph ________ correctly depicts the short-run Phillips Curve.
A) A
B) B
C) C
D) D
Correct Answer:

Verified
Correct Answer:
Verified
Related Questions
Q200: An unexpected increase in aggregate demand<br>A) will
Q201: The short run aggregate supply (SRAS) curve
Q202: If a group of economists believes the
Q203: <img src="https://d2lvgg3v3hfg70.cloudfront.net/TB5018/.jpg" alt=" -Refer to the
Q204: One result of an unanticipated reduction in
Q206: Structural unemployment may result from all of
Q207: What is meant by the natural rate
Q208: If the price of sugar changed in
Q209: An unexpected increase in aggregate demand<br>A) causes
Q210: Real business cycle theory explains changes in