Multiple Choice
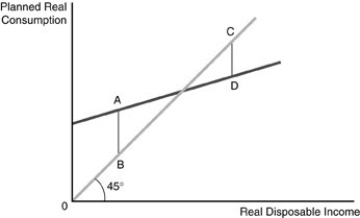
-Refer to the above figure. The figure represents the consumption function for a consumer. The distance between C and D represents
A) the amount of autonomous consumption.
B) the amount of saving.
C) the amount of dissaving.
D) the point where saving equals zero.
Correct Answer:

Verified
Correct Answer:
Verified
Q102: Explain how the aggregate demand curve is
Q103: When the equilibrium price level adjusts to
Q104: Which one of the following statements is
Q105: If the MPS is 1/3, a $200
Q106: When graphing the consumption function, what purpose
Q108: <img src="https://d2lvgg3v3hfg70.cloudfront.net/TB5018/.jpg" alt=" -Refer to the
Q109: Suppose marginal propensity to consume (MPC) is
Q110: <img src="https://d2lvgg3v3hfg70.cloudfront.net/TB5018/.jpg" alt=" -Refer to the
Q111: <img src="https://d2lvgg3v3hfg70.cloudfront.net/TB5018/.jpg" alt=" -The above figure
Q112: Suppose that there is no government and