Multiple Choice
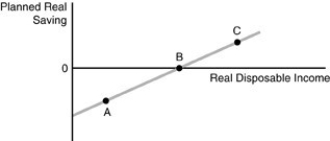
-Refer to the above figure. The figure represents the saving function for the consumer. Point C represents
A) the amount of autonomous consumption.
B) a situation in which saving is positive.
C) a situation in which saving is negative.
D) the point at which saving equals zero.
Correct Answer:

Verified
Correct Answer:
Verified
Q396: The equation is the <img src="https://d2lvgg3v3hfg70.cloudfront.net/TB5018/.jpg" alt="The
Q397: Suppose equilibrium for an economy occurs when
Q398: According to Keynes, planned consumption<br>A) decreases as
Q399: When graphing the consumption function, we include
Q400: Along the portion of the consumption function
Q402: The average propensity to consume is<br>A) real
Q403: <img src="https://d2lvgg3v3hfg70.cloudfront.net/TB5018/.jpg" alt=" -In the above
Q404: The ownership of stock of assets is<br>A)
Q405: The marginal propensity to consume (MPC) is<br>A)
Q406: If the marginal propensity to consume (MPC)