Multiple Choice
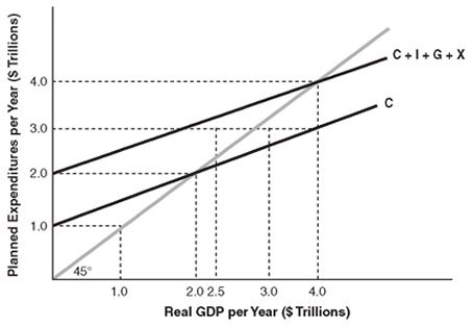
-In the above figure, the equilibrium level of planned saving plus net taxes is
A) $1.0 trillion.
B) $2.0 trillion.
C) $3.0 trillion.
D) $4.0 trillion.
Correct Answer:

Verified
Correct Answer:
Verified
Q411: Your real disposable income is your real
Q412: The marginal propensity to consume (MPC) can
Q413: Which of the following theories predicts that
Q414: When the economy is operating at the
Q415: Suppose the marginal propensity to consume (MPC)
Q417: <img src="https://d2lvgg3v3hfg70.cloudfront.net/TB5018/.jpg" alt=" -In the above
Q418: <img src="https://d2lvgg3v3hfg70.cloudfront.net/TB5018/.jpg" alt=" -Refer to the
Q419: Spending on new goods and services out
Q420: Which of the following is considered investment?<br>A)
Q421: Autonomous consumption<br>A) is measured by the slope