Multiple Choice
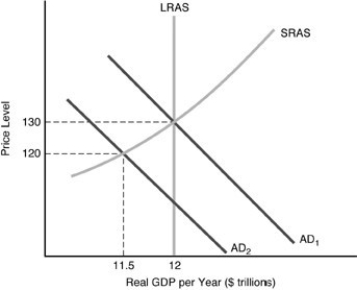
-In the above figure, what are the long-run equilibrium price level and real GDP?
A) 130 and $12 trillion
B) 130 and $11.5 trillion
C) 120 and $11.5 trillion
D) 120 and $12 trillion
Correct Answer:

Verified
Correct Answer:
Verified
Related Questions
Q112: According to classical theory, any changes in
Q113: With respect to unemployment, the classical model
Q114: Using a graph, show the effects of
Q115: Real GDP is _ determined in the
Q116: Whom among the following was a classical
Q118: The short-run aggregate supply curve would shift
Q119: The Keynesian short-run aggregate supply curve is
Q120: A temporary embargo on oil from Saudi
Q121: <img src="https://d2lvgg3v3hfg70.cloudfront.net/TB5018/.jpg" alt=" -Consider the above
Q122: A short-run equilibrium occurs<br>A) at the intersection