Multiple Choice
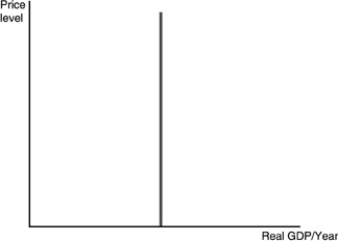
-The curve in the above figure will shift to the right when
A) the price level falls.
B) technology increases.
C) population falls.
D) the proportion of the population that is elderly increases.
Correct Answer:

Verified
Correct Answer:
Verified
Related Questions
Q1: Which of the following will NOT shift
Q32: The downward slope of the aggregate demand
Q41: When the production possibilities curve shifts outward,<br>A)
Q79: The aggregate demand curve<br>A) is vertical at
Q103: Long-run equilibrium will occur at the price
Q114: The long-run aggregate supply curve is<br>A) horizontal
Q151: The aggregate demand curve shows the<br>A) total
Q152: Which of the following is consistent with
Q212: Why is the long-run aggregate supply curve
Q232: The long-run aggregate supply curve shifts right