Multiple Choice
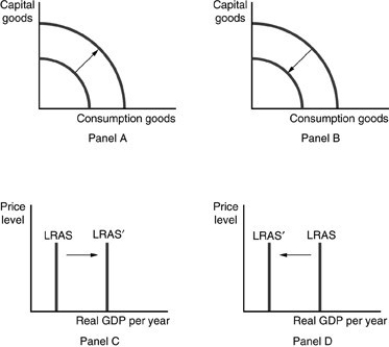
-Refer to the above figures. Which panel(s) represent economic growth?
A) Panel A only
B) Panels A and C only
C) Panel D only
D) Panels B and D only
Correct Answer:

Verified
Correct Answer:
Verified
Related Questions
Q282: Other things being equal, along an aggregate
Q283: According to the real-balance effect, the value
Q284: <img src="https://d2lvgg3v3hfg70.cloudfront.net/TB5018/.jpg" alt=" -The above figure
Q285: The total of all planned production for
Q286: A persistent decline in the price level
Q288: Economic growth can be depicted as<br>A) a
Q289: Over the past 40 years, which of
Q290: We draw the long-run aggregate supply curve
Q291: Which of the following is a factor
Q292: The long-run aggregate supply curve is determined