Multiple Choice
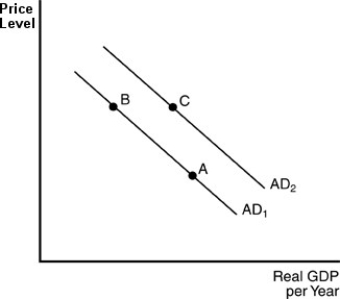
-In the above figure, a movement from point A to point B can be explained by
A) an decrease in the quantity of money in circulation.
B) a decrease in the real value of cash balances.
C) the decrease in interest rates.
D) the increase in exports to the foreign sector.
Correct Answer:

Verified
Correct Answer:
Verified
Q131: As the capital stock reduces , we
Q132: The total of all planned production for
Q133: Long-run aggregate supply is<br>A) the possible combinations
Q134: Which of the following will cause a
Q135: What information is provided by the aggregate
Q137: Suppose that an economy is initially producing
Q138: An assumption on the LRAS curve is<br>A)
Q139: The long-run aggregate supply curve<br>A) shifts to
Q140: The real-balance effect implies that when<br>A) the
Q141: Long-run aggregate supply reflects<br>A) total production in