Multiple Choice
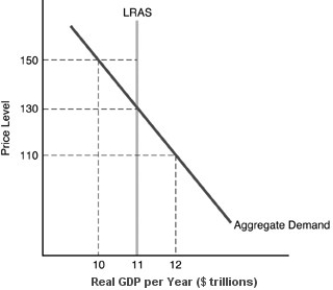
-In the above figure, the long-run equilibrium price level is
A) 150.
B) 130.
C) 110.
D) not displayed.
Correct Answer:

Verified
Correct Answer:
Verified
Related Questions
Q219: Decreases in interest rates have made it
Q220: A persistently declining price level resulting from
Q221: Total planned real expenditures measured along the
Q222: Which of the following cause the aggregate
Q223: The real output of the economy under
Q225: If there are steady decreases in aggregate
Q226: Economic growth can be thought of as<br>A)
Q227: If there is persistent inflation<br>A) long-run aggregate
Q228: All of the following are components of
Q229: Over the last twenty years, real GDP