Multiple Choice
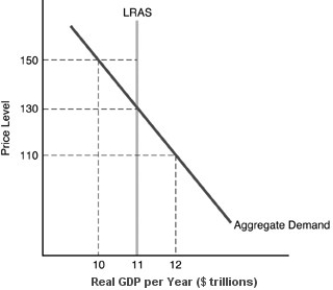
-In the above figure, the long-run equilibrium real GDP is
A) $10 trillion.
B) $11 trillion.
C) $12.trillion
D) not displayed.
Correct Answer:

Verified
Correct Answer:
Verified
Related Questions
Q241: The long-run aggregate supply curve is<br>A) horizontal.<br>B)
Q242: The real-balance effect refers to<br>A) the real
Q243: The aggregate demand curve gives the<br>A) planned
Q244: A human resource such as ingenuity can
Q245: The curve in the above figure will
Q247: What is measured on the vertical axis
Q248: Other things being equal, the economy's aggregate
Q249: What will be the result in a
Q250: <img src="https://d2lvgg3v3hfg70.cloudfront.net/TB5018/.jpg" alt=" -Refer to the
Q251: The U.S. economy has had persistent inflation