True/False
The figure below is an example of a negatively skewed distribution. 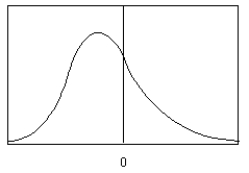
Correct Answer:

Verified
Correct Answer:
Verified
Related Questions
Q8: In applied statistics, it is the area
Q71: The average age of vehicles registered in
Q72: Find the z value to the right
Q73: X is a normally distributed random variable
Q74: Find the z value that corresponds to
Q75: The difference between a sample mean and
Q76: Find the probability <img src="https://d2lvgg3v3hfg70.cloudfront.net/TB1705/.jpg" alt="Find the
Q77: The average age of doctors in a
Q78: As the sample size n increases,
Q79: Of the members of a Boy Scout