Essay
For the following data, construct a graph showing the probability distribution. 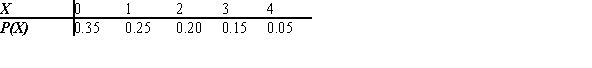
Correct Answer:

Verified
Correct Answer:
Verified
Related Questions
Q23: The failure rate for taking the bar
Q24: Use the multinomial formula and find the
Q25: If there are 20 typographical errors randomly
Q26: In the instructor's answer book for a
Q27: Find the mean of the distribution shown.
Q29: In a survey, 55% of the voters
Q30: Find the variance for the values of
Q31: Compute the probability of X successes.<br>N =
Q32: Find the mean of the distribution shown
Q33: Which of the following variables are discrete?<br>i.