Multiple Choice
Which plot below has a five-number summary of 5, 7, 8, 12, 13 and an interquartile range of 5?
A) 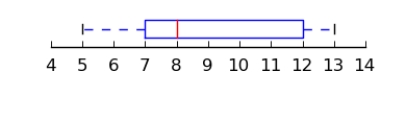
B) 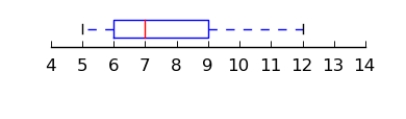
C) 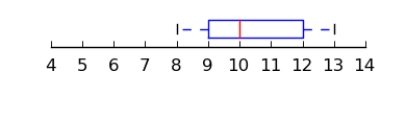
D) 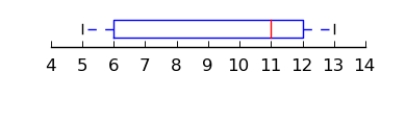
Correct Answer:

Verified
Correct Answer:
Verified
Related Questions
Q19: identifies a minimum percentage of the data
Q31: divide a distribution into four groups, and
Q31: Find the weighted mean for a particular
Q32: Given the following data set, find the
Q37: Find the mean of the following set
Q38: The size of the box in a
Q39: In a unimodal, symmetrical distribution as shown
Q40: A characteristic or measure obtained by using
Q80: The is the mode for grouped data.
Q86: The range of a data set is