Multiple Choice
A recent statistics exam yielded the following 25 scores. Construct a grouped frequency distribution with the class limits shown below.
61 90 79 57 63
55 83 70 62 95
90 83 41 72 85
76 82 75 94 57
72 72 46 81 93 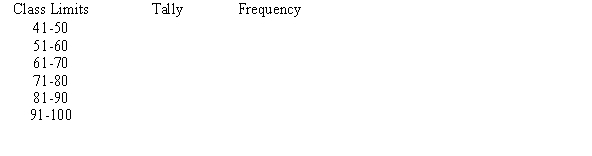
A) 
B) 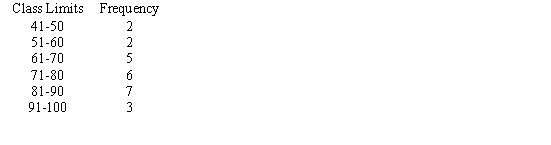
C) 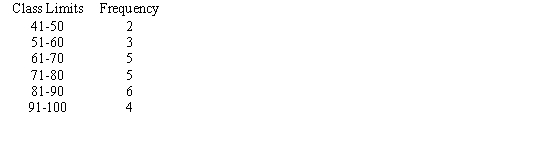
D) 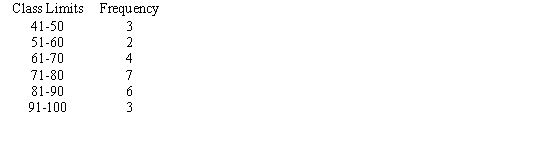
Correct Answer:

Verified
Correct Answer:
Verified
Related Questions
Q3: Thirty students recorded the colors of their
Q4: Construct a frequency polygon from the following
Q5: Using the ogive shown below, what is
Q6: If the limits for a class were
Q6: What is the midpoint of the class
Q8: Find the class with the greatest number
Q9: In an ungrouped frequency distribution of the
Q11: When making Pareto charts, data should be
Q13: A histogram is a graph that represents
Q84: The frequency polygon and the histogram are