Essay
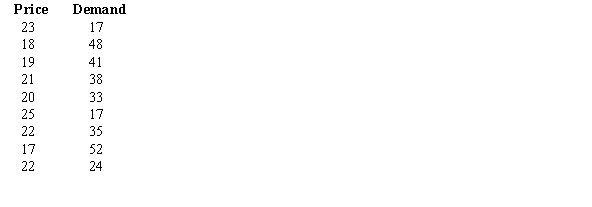
Draw a scatter plot for the following data that show the demand for a product (in hundreds) and its price (in dollars) charged in nine different cities. 
Correct Answer:

Verified
Correct Answer:
Verified
Related Questions
Q2: If the correlation coefficient r is equal
Q4: If the equation for the regression line
Q5: If the equation for the regression line
Q6: The standard error of estimate can be
Q7: A researcher has reason to believe that,
Q8: Ten pairs of points yielded a correlation
Q9: With enough variables, it is possible to
Q10: If the equation for the regression line
Q11: What is the value of <img src="https://d2lvgg3v3hfg70.cloudfront.net/TB1705/.jpg"
Q29: The variation due to chance, found by