Multiple Choice
The graph of the feasible region for a mixture problem is shown below. Find the point that maximizes the profit function P = 2x + 3y. 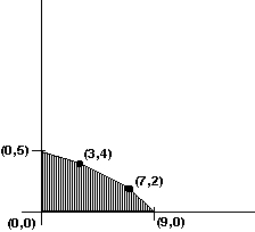
A) (0, 5)
B) (3, 4)
C) (7, 2)
D) (9, 0)
Correct Answer:

Verified
Correct Answer:
Verified
Related Questions
Q55: Find the graph of the inequality 4x
Q56: Solve this linear programming mixture problem: Kim
Q57: Use the following tableau to answer the
Q58: Write the resource constraints for this situation:
Q59: Find the constraint inequalities and the profit
Q61: The graph of the feasible region for
Q62: What type of solution does the Northwest
Q63: Find the point of intersection for the
Q64: Write the resource constraints for this situation:
Q65: An optimal solution for a linear programming