Multiple Choice
The graph of the feasible region for a mixture problem is shown below. Find the point that maximizes the profit function P = 3x + 6y. 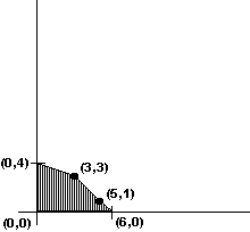
A) (0, 4)
B) (3, 3)
C) (5, 1)
D) (6, 0)
Correct Answer:

Verified
Correct Answer:
Verified
Related Questions
Q23: Explain why the feasible region for a
Q24: Find the point of intersection for the
Q25: Use the following to answer the Questions:<br>concern
Q26: Find the graph of the equation 4x
Q27: The simplex algorithm always gives optimal solutions
Q29: Given below is the sketch of the
Q30: Solve this linear programming mixture problem: A
Q31: Find the point of intersection of the
Q32: Consider the feasible region identified by the
Q33: Explain what the real world implications are