Multiple Choice
Refer to the diagram below. A shift in the aggregate demand curve from AD1 to AD0 might be caused by a(n) : 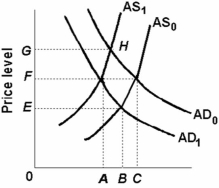
A) decrease in aggregate supply.
B) decrease in the amount of output supplied.
C) increase in investment spending.
D) decrease in net export spending.
Correct Answer:

Verified
Correct Answer:
Verified
Q14: <img src="https://d2lvgg3v3hfg70.cloudfront.net/TB2474/.jpg" alt=" -Refer to the
Q38: Which would be considered to be one
Q49: An increase in business taxes will shift
Q53: The Great Moderation refers to:<br>A)the period from
Q54: <img src="https://d2lvgg3v3hfg70.cloudfront.net/TB2474/.jpg" alt=" -Refer to the
Q68: The foreign trade effect suggests that a
Q82: In terms of aggregate supply, the difference
Q112: A rightward shift in the aggregate supply
Q115: A decrease in aggregate demand is most
Q154: All else equal, an increase in imports