Multiple Choice
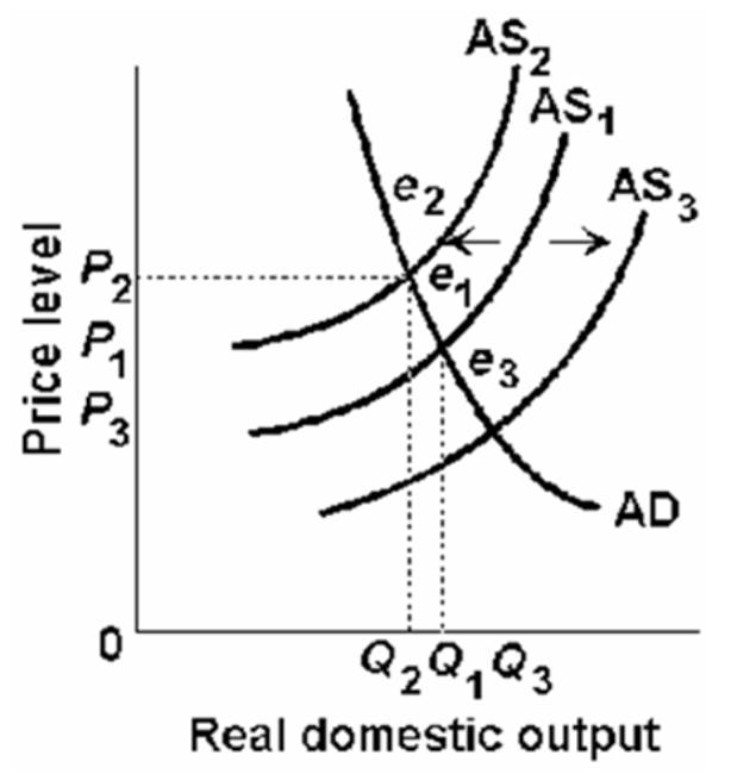
-Refer to the above diagram.Cost-push inflation can be illustrated by a:
A) shift in the aggregate supply curve from AS1 to AS2.
B) shift in the aggregate supply curve from AS1 to AS3.
C) shift in the aggregate supply curve from AS2 to AS3.
D) movement along the aggregate demand curve from e1 to e3.
Correct Answer:

Verified
Correct Answer:
Verified
Q17: Which of the following would not shift
Q30: Using the aggregate demand-aggregate supply (short-run) model,
Q80: The following table is for a particular
Q85: Which of the following is incorrect?<br>A)As the
Q85: The following table gives information about the
Q86: Which of the following explains why the
Q101: A decrease in interest rates caused by
Q123: The shape of the aggregate demand curve
Q170: The determinants of aggregate supply:<br>A)are consumption, investment,
Q202: When deriving the aggregate demand (AD) curve