Multiple Choice
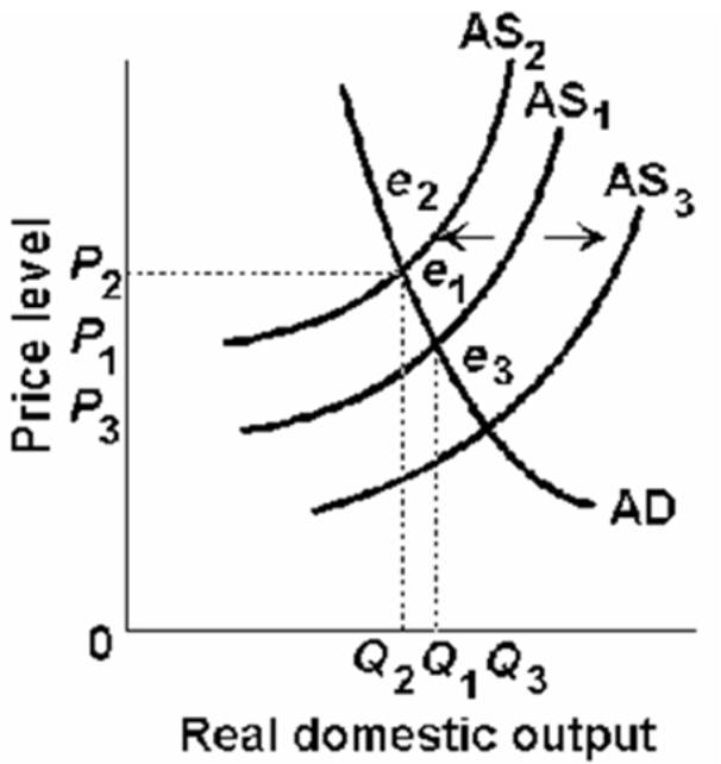
-Refer to the above diagram.When output increases from Q1 and the price level decreases from P1,this change will:
A) be caused by a shift in the aggregate supply curve from AS1 to AS2.
B) be caused by a shift in the aggregate supply curve from AS1 to AS3.
C) result in a movement along the aggregate demand curve from e1 to e2.
D) result in a movement along the aggregate demand curve from e3 to e1.
Correct Answer:

Verified
Correct Answer:
Verified
Q90: Other things being equal, the higher the
Q140: Suppose the aggregate demand and short-run aggregate
Q174: Other things equal, an improvement in productivity
Q181: <img src="https://d2lvgg3v3hfg70.cloudfront.net/TB2474/.jpg" alt=" -Refer to the
Q182: <img src="https://d2lvgg3v3hfg70.cloudfront.net/TB2474/.jpg" alt=" -In the above
Q183: <img src="https://d2lvgg3v3hfg70.cloudfront.net/TB2474/.jpg" alt=" -Refer to the
Q186: Refer to the data below.The vertical range
Q188: Refer to the table below.If this nation's
Q189: Refer to the above diagram.If the price
Q190: <img src="https://d2lvgg3v3hfg70.cloudfront.net/TB2474/.jpg" alt=" -Refer to the