Multiple Choice
Assume that for the entire business sector of a private closed economy there is $0 worth of investment projects which will yield an expected rate of return of 25 percent or more. But there are $15 worth of investments which will yield an expected rate of return of 20-25 percent; another $15 with an expected rate of return of 15-20 percent; and similarly an additional $15 of investment projects in each successive rate of return range down to and including the 0-5 percent range. 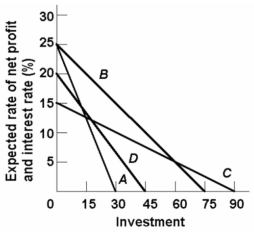 Which of the lines on the above diagram represents these data?
A) A
B) B
C) C
D) D
Correct Answer:

Verified
Correct Answer:
Verified
Q22: The saving schedule shown in the diagram
Q29: Firms make planned changes to their inventories:<br>A)if
Q31: If a $50 billion decrease in investment
Q37: Following is consumption schedules for three private
Q54: The increase in income which results from
Q57: The simple multiplier is:<br>A)1/APS.<br>B)1/APC.<br>C)1/MPC.<br>D)1/MPS.
Q122: Which of the following will not tend
Q131: The simple multiplier may be calculated as:<br>A)1/(MPS
Q173: <img src="https://d2lvgg3v3hfg70.cloudfront.net/TB2474/.jpg" alt=" -Refer to the
Q198: If the MPS is only half as