Multiple Choice
Refer to the diagram below. The concave shape of each production possibilities curve indicates that: 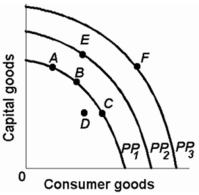
A) resources are perfectly substitutable.
B) wants are virtually unlimited.
C) prices are constant.
D) resources are not equally suited for alternative uses.
Correct Answer:

Verified
Correct Answer:
Verified
Q6: Production possibilities tables for two countries, North
Q26: <img src="https://d2lvgg3v3hfg70.cloudfront.net/TB2474/.jpg" alt=" -In line (3)on
Q54: <img src="https://d2lvgg3v3hfg70.cloudfront.net/TB2474/.jpg" alt=" -Refer to the
Q97: <img src="https://d2lvgg3v3hfg70.cloudfront.net/TB2474/.jpg" alt=" -Refer to the
Q100: <img src="https://d2lvgg3v3hfg70.cloudfront.net/TB2474/.jpg" alt=" -Refer to the
Q109: The concept of opportunity cost<br>A) is irrelevant
Q172: <img src="https://d2lvgg3v3hfg70.cloudfront.net/TB2474/.jpg" alt=" -In the above
Q175: <img src="https://d2lvgg3v3hfg70.cloudfront.net/TB2474/.jpg" alt=" -In the above
Q193: <img src="https://d2lvgg3v3hfg70.cloudfront.net/TB2474/.jpg" alt=" -Refer to the
Q218: Consumers spend their incomes to get the