Essay
Project 2.1
Joey Koons runs a small custom computer parts company. As a sideline he offers customized and pre-built computer system packages. In preparation for the upcoming school year, he has decided to offer two custom computer packages tailored for what he believes are current student needs. System A provides a strong computing capability at a reasonable cost while System B provides a much more powerful computing capability, but at a higher cost. Joey has a fairly robust parts inventory but is concerned about his stock of those components that are common to each proposed system. A portion of his inventory, the item cost, and inventory level is provided in the table below. 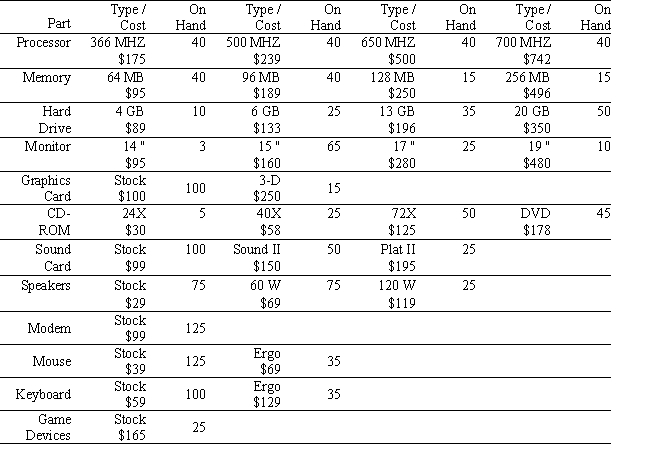 The requirements for each system are provided in the following table:
 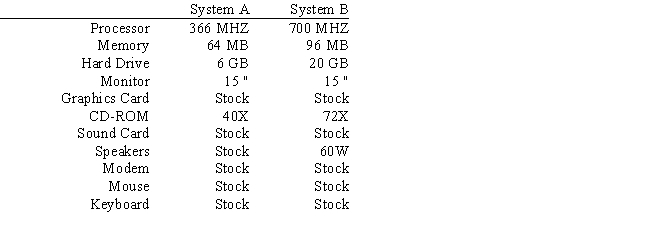 Each system requires assembly, testing and packaging. The requirements per system built and resources available are summarized in the table below.
 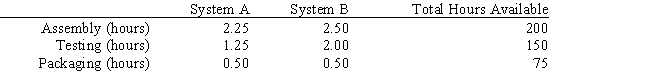 Joey is uncertain about product demand. In the past he has put together similar types of computer packages but his sales results vary. As a result is unwilling to commit all his in-house labor force to building the computer packages. He is confident he can sell all he can build and is not overly concerned with lost sales due to stock-outs. Based on his market survey, he has completed his advertising flyer and will offer System A for $ 1250 and will offer system B for $ 2325. Joey now needs to let his workers know how many of each system to build and he wants that mix to maximize his profits.
Formulate an LP for Dave's problem. Solve the model using the graphical method. What is Dave's preferred product mix? What profit does Dave expect to make from this product mix?
Correct Answer:

Verified
The cost to make System A is $1007. 00 w...View Answer
Unlock this answer now
Get Access to more Verified Answers free of charge
Correct Answer:
Verified
View Answer
Unlock this answer now
Get Access to more Verified Answers free of charge
Q66: The constraint for resource 1 is 5
Q67: For an infeasible problem, the feasible region:<br>A)
Q68: Limited resources are modeled in optimization problems
Q69: Why do we study the graphical method
Q70: Level curves are used when solving LP
Q71: The first step in formulating a linear
Q72: Solve the following LP problem graphically using
Q74: The second step in formulating a linear
Q75: When do alternate optimal solutions occur in
Q76: Solve the following LP problem graphically by