Essay
Exhibit 9.1
The following questions are based on the problem description and spreadsheet below.
A company has built a regression model to predict the number of labor hours (Yi) required to process a batch of parts (Xi). It has developed the following Excel spreadsheet of the results. 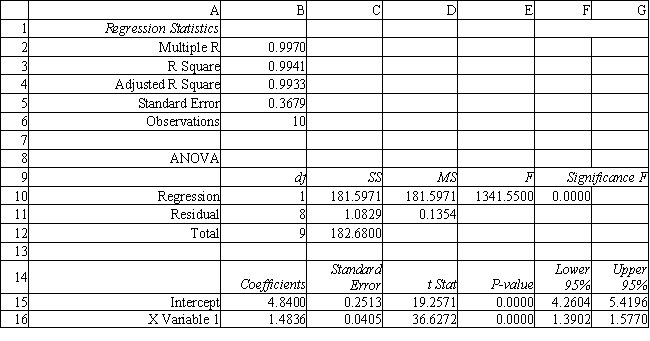
-Refer to Exhibit 9.1. What is the estimated regression function for this problem? Explain what the terms in your equation mean.
Correct Answer:

Verified
 The average labor hours for a...
View Answer
Unlock this answer now
Get Access to more Verified Answers free of charge
Correct Answer:
Verified
View Answer
Unlock this answer now
Get Access to more Verified Answers free of charge
Q30: Exhibit 9.5<br>The following questions are based on
Q31: A pattern resulting from random variation or
Q32: What is the formula for total sum
Q33: When using the Regression tool in Excel
Q34: Exhibit 9.2<br>The following questions are based on
Q36: Exhibit 9.1<br>The following questions are based on
Q37: Exhibit 9.1<br>The following questions are based on
Q38: What goodness-of-fit measure is commonly used to
Q39: The regression line denotes the _ between
Q40: In the equation Y = β<sub>0</sub> +