Essay
Exhibit 9.3
The following questions are based on the problem description and spreadsheet below.
A researcher is interested in determining how many calories young men consume. She measured the age of the individuals and recorded how much food they ate each day for a month. The average daily consumption was recorded as the dependent variable. She has developed the following Excel spreadsheet of the results. 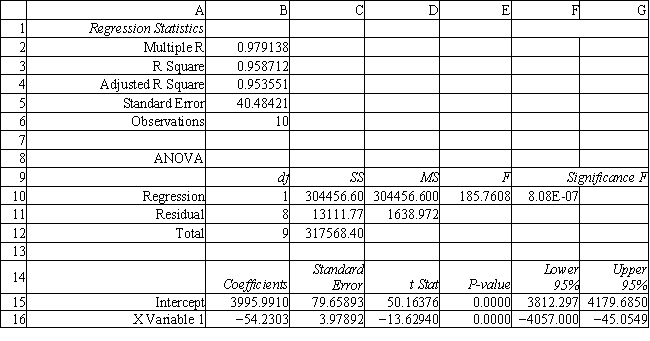
-Refer to Exhibit 9.3. Predict the mean number of calories consumed by a 19 year old man.
Correct Answer:

Verified
Correct Answer:
Verified
Q83: The standard prediction error is<br>A) always smaller
Q84: In regression analysis, the total variation is:<br>A)
Q85: The R<sup>2</sup> statistic<br>A) varies between −1 and
Q86: Which of the following cannot be negative?<br>A)
Q87: Exhibit 9.6<br>The partial regression output below applies
Q88: Exhibit 9.5<br>The following questions are based on
Q90: R<sup>2</sup> is calculated as<br>A) ESS/TSS<br>B) 1 −
Q91: In regression analysis, we consider models
Q92: How many independent variables are there in
Q93: The adjusted R<sup>2</sup> statistic<br>A) is equal to