Essay
Exhibit 9.3
The following questions are based on the problem description and spreadsheet below.
A researcher is interested in determining how many calories young men consume. She measured the age of the individuals and recorded how much food they ate each day for a month. The average daily consumption was recorded as the dependent variable. She has developed the following Excel spreadsheet of the results. 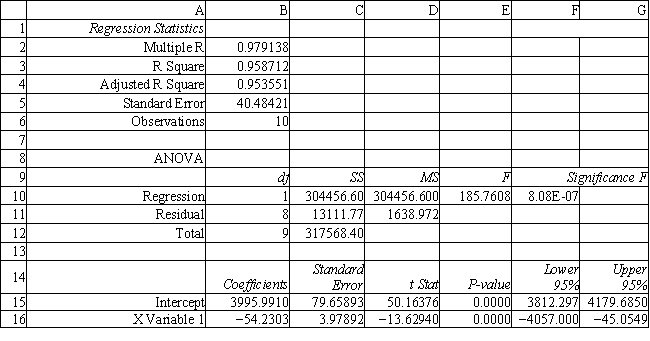
-Refer to Exhibit 9.3. Test the significance of the model and explain which values you used to reach your conclusions.
Correct Answer:

Verified
The regression model is signif...View Answer
Unlock this answer now
Get Access to more Verified Answers free of charge
Correct Answer:
Verified
View Answer
Unlock this answer now
Get Access to more Verified Answers free of charge
Q77: Residuals are assumed to be<br>A) dependent, uniformly
Q78: The forecasting model that makes use of
Q79: Exhibit 9.3<br>The following questions are based on
Q80: The value of adjusted R<sup>2</sup> can be
Q81: Which of the following is an advantage
Q83: The standard prediction error is<br>A) always smaller
Q84: In regression analysis, the total variation is:<br>A)
Q85: The R<sup>2</sup> statistic<br>A) varies between −1 and
Q86: Which of the following cannot be negative?<br>A)
Q87: Exhibit 9.6<br>The partial regression output below applies