Essay
Exhibit 10.6
The information below is used for the following questions.
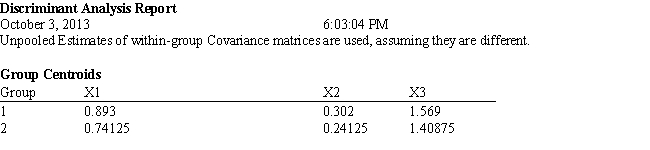
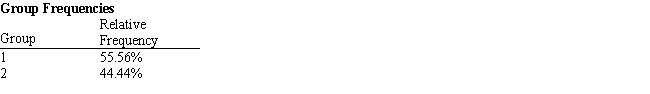
An investor wants to classify companies as being either a good investment, Group 1, or a poor investment, Group 2. He has gathered Liquidity, Profitability and Activity data on 18 companies he has invested in and run a regression analysis. Discriminant Analysis output has also been generated. The data for the problem and the relevant output are shown below. 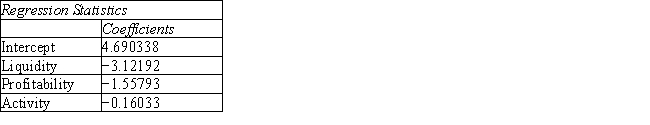
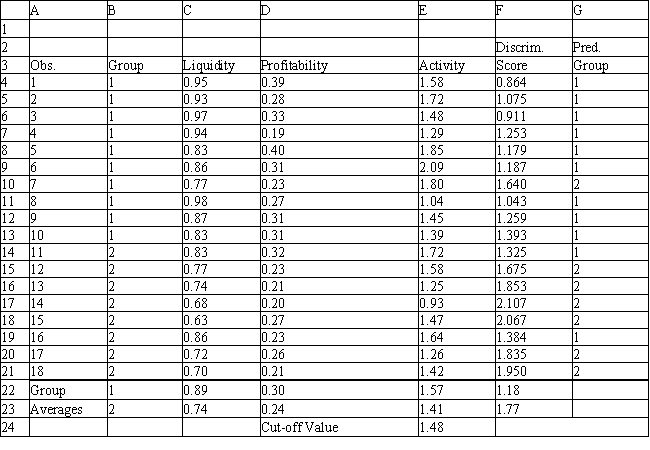
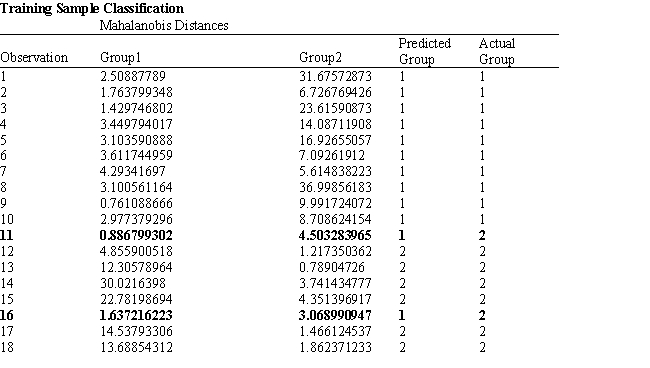
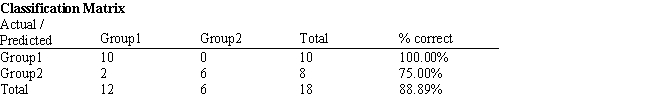
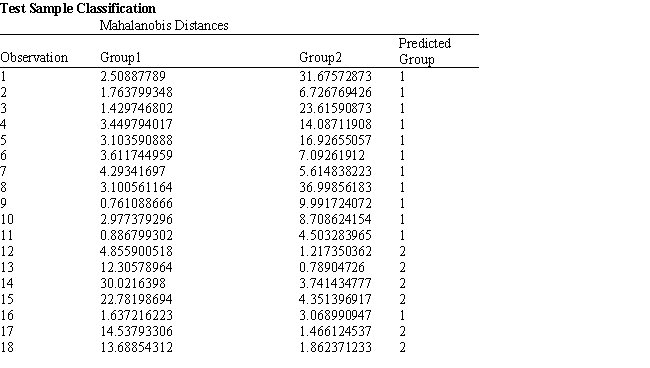
-Refer to Exhibit 10.6. What formulas should go in cells C22:D23, E4:G24, and F24 of the spreadsheet?
Correct Answer:

Verified
Correct Answer:
Verified
Q86: Affinity analysis is a data mining technique
Q87: Neural networks are<br>A) a pattern recognition technique<br>B)
Q88: A correlation coefficient<br>A) measures the strength of
Q89: Oversampling forces a classification method to<br>A) discriminate
Q90: Exhibit 10.1<br>The following questions are based on
Q92: Exhibit 10.4<br>The information below is used for
Q93: In the k nearest neighbor technique, a
Q94: Exhibit 10.3<br>The information below is used for
Q95: Suppose that there are 3 variables in
Q96: The dependent variable <img src="https://d2lvgg3v3hfg70.cloudfront.net/TB2300/.jpg" alt="The dependent