Multiple Choice
Exhibit 10.6
The information below is used for the following questions.
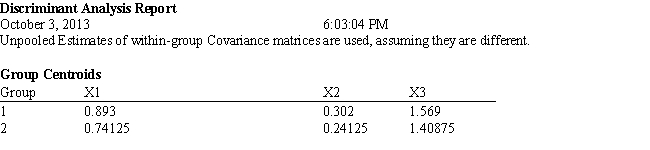
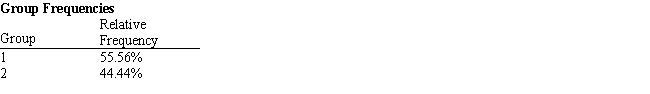
An investor wants to classify companies as being either a good investment, Group 1, or a poor investment, Group 2. He has gathered Liquidity, Profitability and Activity data on 18 companies he has invested in and run a regression analysis. Discriminant Analysis output has also been generated. The data for the problem and the relevant output are shown below. 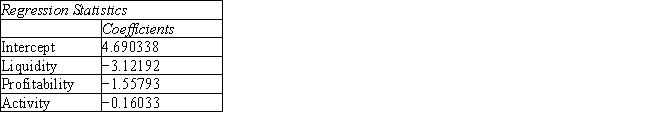
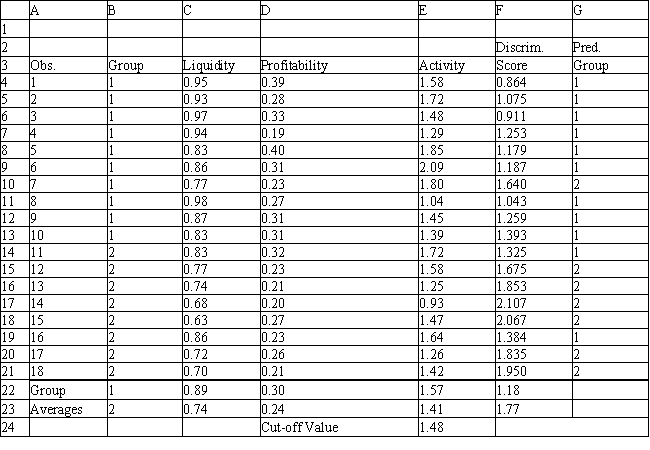
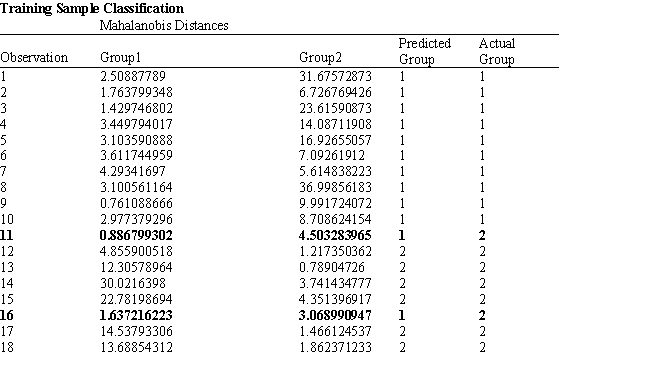
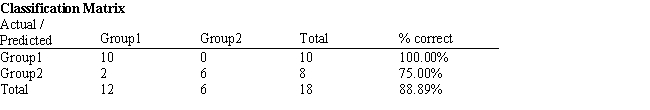
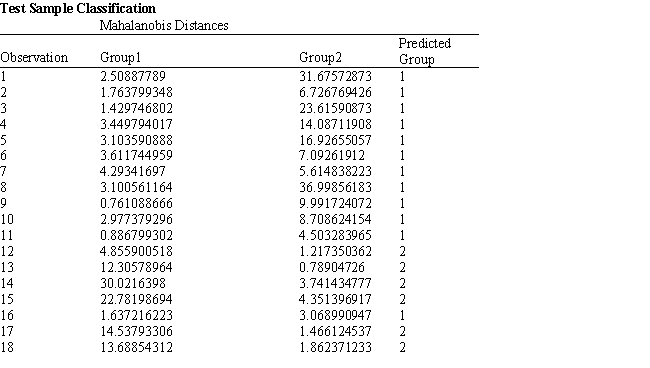
-Refer to Exhibit 10.6. Based on the 20 observations, what percentage of the observations are correctly classified?
A) 80.00%
B) 88.89%
C) 75.25%
D) 95.14%
Correct Answer:

Verified
Correct Answer:
Verified
Q58: The objective of classification tree algorithms is
Q59: Exhibit 10.1<br>The following questions are based on
Q60: In hierarchical clustering, the measure of similarity
Q61: Discriminant analysis (DA) differs from most other
Q62: Data mining tasks fall in the following
Q64: A classification tree is a graphical representation
Q65: The data might be normalized so that
Q66: Suppose that all observations in partition j
Q67: Suppose that the correlation coefficient between X<sub>1</sub>
Q68: Exhibit 10.1<br>The following questions are based on