Multiple Choice
Exhibit 11.6
The following questions use the data below.
A store wants to predict quarterly sales. The owner has collected 3 years of sales data and wants your help in analyzing the data using the double moving average model with k = 4. 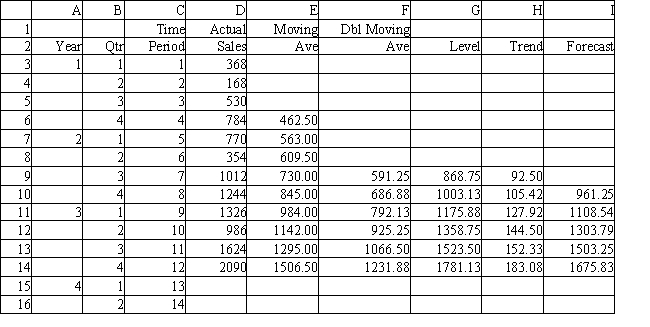
-Refer to Exhibit 11.6. What are predicted sales for time period 16 using the data in the spreadsheet?
A) 1964 ≤ predicted sales < 1965
B) 2147 ≤ predicted sales < 2148
C) 2330 ≤ predicted sales < 2331
D) 2513 ≤ predicted sales < 2513
Correct Answer:

Verified
Correct Answer:
Verified
Q32: How many indicator variables are required if
Q33: Exhibit 11.15<br>The following questions use the data
Q34: Exhibit 11.8<br>The following questions use the data
Q35: Exhibit 11.9<br>The following questions use the data
Q36: MAD, MAPE, MSE and RMSE are measures
Q38: Exhibit 11.9<br>The following questions use the data
Q39: Exhibit 11.8<br>The following questions use the data
Q40: Exhibit 11.12<br>The following questions use the data
Q41: Exhibit 11.15<br>The following questions use the data
Q42: Exhibit 11.17<br>The following questions use the data