Multiple Choice
Exhibit 11.7
The following questions use the data below.
Joe's Sporting Goods wants to forecast quarterly sales figures using Holt's method. The store has collected 12 quarters of data and needs your help to analyze the data. 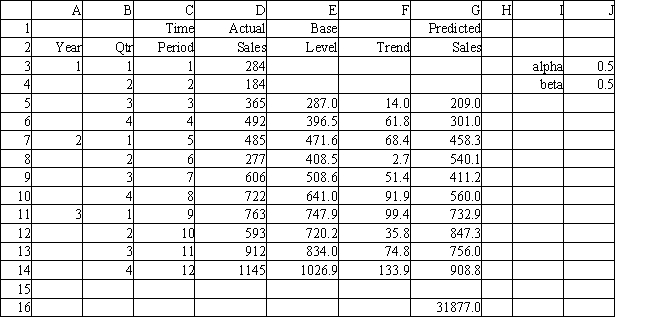
-Refer to Exhibit 11.7. What are predicted sales for time period 2 using the data in the spreadsheet?
A) 208.5 ≤ predicted sales < 209.5
B) 233.5 ≤ predicted sales < 234.5
C) 283.5 ≤ predicted sales < 284.5
D) 300.5 ≤ predicted sales < 301.5
Correct Answer:

Verified
Correct Answer:
Verified
Q40: Exhibit 11.12<br>The following questions use the data
Q41: Exhibit 11.15<br>The following questions use the data
Q42: Exhibit 11.17<br>The following questions use the data
Q43: Exhibit 11.3<br>The following questions use the data
Q44: Exhibit 11.4<br>The following questions use the data
Q46: Exhibit 11.9<br>The following questions use the data
Q47: The general form of an extrapolation model
Q48: Exhibit 11.12<br>The following questions use the data
Q49: How is mean absolute deviation calculated?<br>A) <img
Q50: Exhibit 11.2<br>The following questions use the data