Essay
Exhibit 11.22
The following questions use the data below.
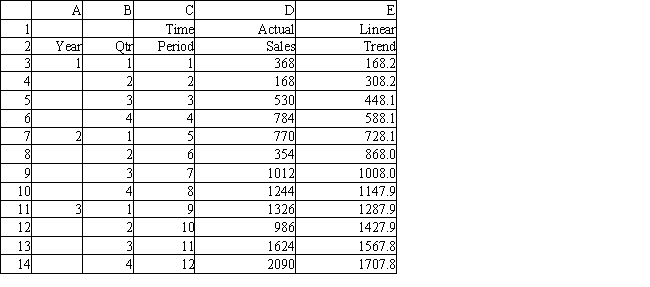
A store wants to predict quarterly sales. The owner has collected 3 years of sales data and wants your help in analyzing the data. He wants to use regression and a linear trend model. 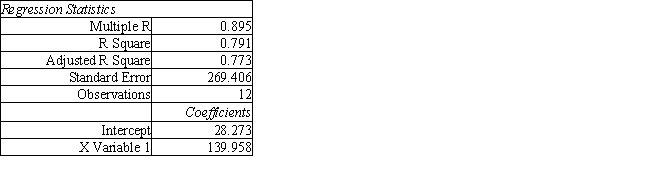
-Refer to Exhibit 11.22. Interpret the R2 value for your model.
Correct Answer:

Verified
The R2 value of 0. 791 means th...View Answer
Unlock this answer now
Get Access to more Verified Answers free of charge
Correct Answer:
Verified
View Answer
Unlock this answer now
Get Access to more Verified Answers free of charge
Q83: Exhibit 11.10<br>The following questions use the data
Q84: Exhibit 11.6<br>The following questions use the data
Q85: Exhibit 11.21<br>The following questions use the data
Q86: Exhibit 11.8<br>The following questions use the data
Q87: Assume that seasonality exists in the monthly
Q89: Seasonality is a regular, repeating pattern in
Q90: A time series which has no significant
Q91: Exhibit 11.19<br>The following questions use the data
Q92: As the number of periods in the
Q93: Exhibit 11.14<br>The following questions use the data