Multiple Choice
A random sample of 40 companies with assets over $10 million was surveyed and asked to indicate their industry and annual computer technology expense. The ANOVA comparing the average computer technology expense among three industries rejected the null hypothesis. The Mean Square Error (MSE) was 195. The following table summarized the results: 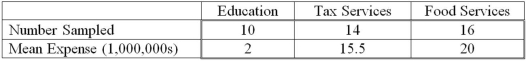 When comparing the mean annual computer technology expense for companies in the education and tax services industries, the following 95% confidence interval can be constructed: _______________.
A) 13.5 ± 2.026 * 5.78
B) 13.5 ± 2.021 * 5.78
C) 13.5 ± 2.026 * 13.96
D) 13.5 ± 2.021 * 13.96
Correct Answer:

Verified
Correct Answer:
Verified
Q23: The F-distribution's curve is positively skewed.
Q28: An experiment to determine the most effective
Q32: The annual dividend rates for a random
Q33: A manufacturer of automobile transmissions uses three
Q35: For the hypothesis test, <img src="https://d2lvgg3v3hfg70.cloudfront.net/TB4677/.jpg" alt="For
Q36: Two accounting professors decided to compare the
Q40: In a study of protein breakfast bars,
Q54: The F distribution is useful when testing
Q109: A sum of squares divided by its
Q117: An F statistic is _.<br>A) A ratio