Multiple Choice
A random sample of 40 companies with assets over $10 million was surveyed and asked to indicate their industry and annual computer technology expense. The ANOVA comparing the average computer technology expense among three industries rejected the null hypothesis. The Mean Square Error (MSE) was 195. The following table summarized the results: 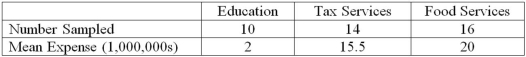 Based on the comparison between the mean annual computer technology expense for companies in the education and tax services industries, _________________.
A) A confidence interval shows that the mean annual computer technology expenses are not significantly different
B) The ANOVA results show that the mean annual computer technology expenses are significantly different
C) A confidence interval shows that the mean annual computer technology expenses are significantly different
D) The ANOVA results show that the mean annual computer technology expenses are not significantly different
Correct Answer:

Verified
Correct Answer:
Verified
Q13: If a confidence interval for the difference
Q15: A large department store examined a sample
Q19: In a study of protein breakfast bars,
Q35: What is the advantage of using ANOVA
Q40: A manufacturer of automobile transmissions uses two
Q42: Two accounting professors decided to compare the
Q45: The annual dividend rates for a random
Q46: Two accounting professors decided to compare the
Q49: Two accounting professors decided to compare the
Q86: An ANOVA has three sources of variation.