Multiple Choice
The following graph is _______________. 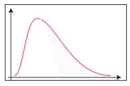
A) Positively skewed
B) Negatively skewed
C) Symmetric
D) Uniformly distributed
Correct Answer:

Verified
Correct Answer:
Verified
Related Questions
Q6: A dot plot is useful for quickly
Q28: What statistics are needed to draw a
Q29: A sample of experienced typists revealed that
Q36: A student scored in the 85<sup>th</sup> percentile
Q41: A telemarketing firm is monitoring the performance
Q44: A _ shows the interquartile range.
Q44: Percentiles divide a distribution into _.<br>A)2 equal
Q48: For the following data, how many observations
Q67: The research director of a large oil
Q71: In a positively skewed distribution, the 50<sup>th</sup>