Essay
A telemarketing firm is monitoring the performance of its employees based on the number of sales per hour. One employee had the following sales for the last 20 hours. Draw a dot plot for the data. 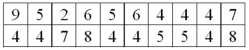
Correct Answer:

Verified
Correct Answer:
Verified
Related Questions
Q3: What does the interquartile range describe?<br>A)The range
Q6: A dot plot is useful for quickly
Q28: What statistics are needed to draw a
Q39: In a symmetric distribution, is the 99<sup>th</sup>
Q40: A _ clearly shows outliers.
Q44: Percentiles divide a distribution into _.<br>A)2 equal
Q45: Quartiles divide a distribution into four equal
Q48: For the following data, how many observations
Q50: Pearson's coefficient of skewness (Sk) ranges from
Q104: The interquartile range is the distance between