Multiple Choice
A student was interested in the cigarette smoking habits of college students and collected data from an unbiased random sample of students. The data is summarized in the following table: 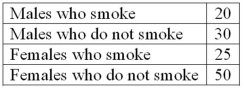 What type of chart best represents the frequency table?
A) Bar chart
B) Box plot
C) Scatter plot
D) Frequency polygon
Correct Answer:

Verified
Correct Answer:
Verified
Q1: When data is collected using a qualitative,
Q8: Refer to the following breakdown of responses
Q11: Refer to the following breakdown of responses
Q16: A group of 100 students was surveyed
Q55: In a bar chart, the x-axis is
Q63: Refer to the following information from a
Q67: Refer to the following information from a
Q90: For a frequency distribution of quantitative data,
Q99: A small sample of computer operators shows
Q125: A _ chart is useful for displaying