Multiple Choice
Refer to the following breakdown of responses to a survey of "How confident are you that you saved enough to retire?" 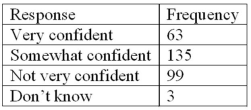 What type of chart should be used to describe the frequency table?
A) A pie chart
B) A bar chart
C) A histogram
D) A frequency polygon
Correct Answer:

Verified
Correct Answer:
Verified
Related Questions
Q10: If the number of observations is 124,
Q25: To calculate a relative frequency, a class
Q41: A class interval, or class width, can
Q43: The monthly salaries of a sample of
Q69: Refer to the following breakdown of responses
Q71: A student was interested in the cigarette
Q72: A data set has 100 observations. In
Q72: Refer to the following wage breakdown for
Q112: The relative frequency for a class represents
Q127: A student was studying the political party