Short Answer
The following frequency distribution shows the distribution of delivery times (in days) for swimstuff.com customer orders during the last month. 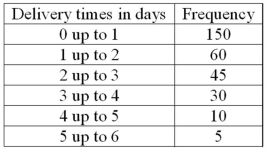 How many orders were delivered from 1 day up to 3 days?
Correct Answer:

Verified
Correct Answer:
Verified
Q53: In a deck of cards, a class
Q85: A _ chart is useful for displaying
Q110: The suggested class interval for a frequency
Q119: Refer to the following distribution of commissions:
Q120: Refer to the following frequency distribution on
Q121: Refer to the following frequency distribution on
Q123: Refer to the following breakdown of responses
Q124: Refer to the following distribution: <img src="https://d2lvgg3v3hfg70.cloudfront.net/TB4677/.jpg"
Q127: The following frequency distribution shows the distribution
Q129: A data set has 200 observations. In