Essay
The following frequency distribution shows the distribution of delivery times (in days) for swimstuff.com customer orders during the last month. 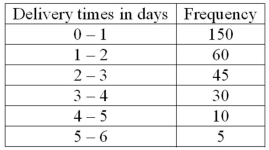 For 300 observations, our rule-of-thumb for number of classes would indicate 9 classes. In this case, what is the class interval and why would it be reasonable to use that class interval and only 6 classes?
Correct Answer:

Verified
The class interval is 1 day. The class i...View Answer
Unlock this answer now
Get Access to more Verified Answers free of charge
Correct Answer:
Verified
View Answer
Unlock this answer now
Get Access to more Verified Answers free of charge
Q5: In a cumulative frequency distribution, the percent
Q18: Ages (rounded to the nearest whole year)
Q28: The first three class marks for a
Q49: Monthly commissions of first-year insurance brokers are
Q51: A frequency distribution for nominal data requires
Q51: When data is collected using a qualitative,
Q52: Refer to the following breakdown of responses
Q53: Refer to the following distribution of commissions:
Q56: Refer to the following breakdown of responses
Q58: The following frequency distribution shows the distribution