Multiple Choice
Table 3-3
Production Opportunities 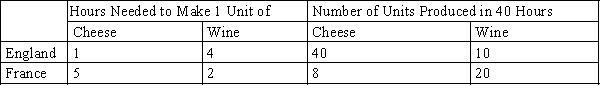
-Refer to Table 3-3. We could use the information in the table to draw a production possibilities frontier for England and a second production possibilities frontier for France. If we were to do this, measuring wine along the horizontal axis, then
A) the slope of England's production possibilities frontier would be -4 and the slope of France's production possibilities frontier would be -0.4.
B) the slope of England's production possibilities frontier would be -0.25 and the slope of France's production possibilities frontier would be -2.5.
C) the slope of England's production possibilities frontier would be 0.25 and the slope of France's production possibilities frontier would be 2.5.
D) the slope of England's production possibilities frontier would be 4 and the slope of France's production possibilities frontier would be 0.4.
Correct Answer:

Verified
Correct Answer:
Verified
Q2: Figure 3-9<br>Uzbekistan's Production Possibilities Frontier<br>Azerbaijan's Production Possibilities
Q10: Ken and Traci are two woodworkers who
Q11: Belarus has a comparative advantage in the
Q66: Figure 3-23<br>The graph below represents the various
Q124: Goods produced abroad and sold domestically are
Q353: Table 3-11<br>Assume that Max and Min can
Q354: Table 3-31<br> <img src="https://d2lvgg3v3hfg70.cloudfront.net/TB1273/.jpg" alt="Table 3-31
Q356: Table 3-10<br>Assume that Japan and Korea can
Q357: Table 3-23<br>Assume that the farmer and the
Q362: Table 3-36 <img src="https://d2lvgg3v3hfg70.cloudfront.net/TB1273/.jpg" alt="Table 3-36