Multiple Choice
Figure 9-2
The figure illustrates the market for calculators in a country. 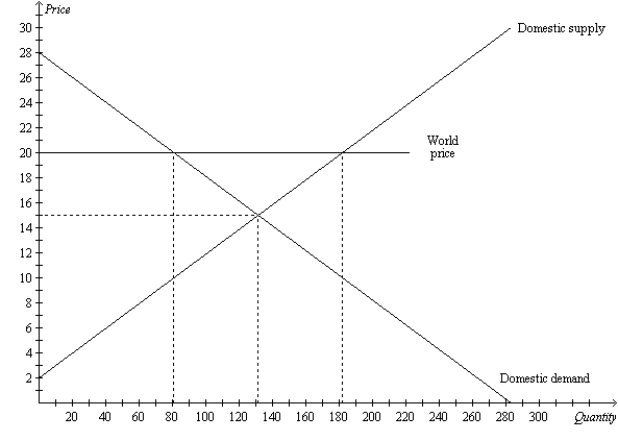
-Refer to Figure 9-2.With free trade,producer surplus is
A) $845.
B) $1,620.
C) $1,690.
D) $3,240.
Correct Answer:

Verified
Correct Answer:
Verified
Q117: Figure 9-6 <img src="https://d2lvgg3v3hfg70.cloudfront.net/TB7555/.jpg" alt="Figure 9-6
Q178: Figure 9-17 <img src="https://d2lvgg3v3hfg70.cloudfront.net/TB2297/.jpg" alt="Figure 9-17
Q179: A quota is<br>A)a tax placed on imports.<br>B)a
Q181: When a country that imports a particular
Q182: Figure 9-12 <img src="https://d2lvgg3v3hfg70.cloudfront.net/TB2297/.jpg" alt="Figure 9-12
Q184: When a country allows trade and becomes
Q185: Figure 9-8.On the diagram below,Q represents the
Q186: When a country that imports a particular
Q187: When a country allows international trade and
Q188: Figure 9-14.On the diagram below,Q represents the