Multiple Choice
Figure 9-21
The following diagram shows the domestic demand and domestic supply for a market.In addition,assume that the world price in this market is $40 per unit. 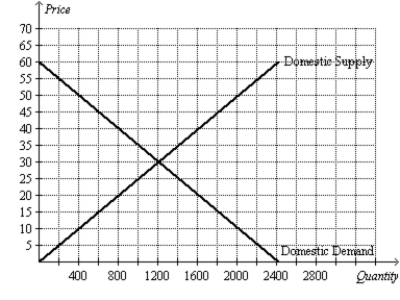
-Refer to Figure 9-21.With free trade,domestic production and domestic consumption,respectively,are
A) 1,200 and 800.
B) 1,600 and 1,200.
C) 1,600 and 800.
D) 1,200 and 1,200
Correct Answer:

Verified
Correct Answer:
Verified
Q198: Figure 9-13 <img src="https://d2lvgg3v3hfg70.cloudfront.net/TB2297/.jpg" alt="Figure 9-13
Q199: Figure 9-26<br>The diagram below illustrates the market
Q200: When a country opens up to trade
Q201: Figure 9-21<br>The following diagram shows the domestic
Q202: Scenario 9-2<br>• For a small country called
Q204: When a country allows trade and becomes
Q205: Figure 9-22<br>The following diagram shows the domestic
Q206: Chile is an importer of computer chips,taking
Q207: Figure 9-2<br>The figure illustrates the market for
Q208: Figure 9-23<br>The following diagram shows the domestic