Multiple Choice
Figure 9-21
The following diagram shows the domestic demand and domestic supply for a market.In addition,assume that the world price in this market is $40 per unit. 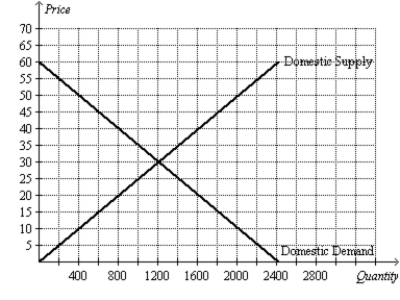
-Refer to Figure 9-21.With free trade allowed,this country
A) exports 200 units of the good.
B) exports 400 units of the good.
C) imports 400 units of the good.
D) exports 800 units of the good.
Correct Answer:

Verified
Correct Answer:
Verified
Q214: Figure 9-5<br>The figure illustrates the market for
Q215: Figure 9-17 <img src="https://d2lvgg3v3hfg70.cloudfront.net/TB2297/.jpg" alt="Figure 9-17
Q216: When a country that imports a particular
Q217: Figure 9-5<br>The figure illustrates the market for
Q218: Figure 9-14.On the diagram below,Q represents the
Q220: Honduras is an importer of goose-down pillows.The
Q221: Figure 9-6<br>The figure illustrates the market for
Q222: Figure 9-5<br>The figure illustrates the market for
Q223: Figure 9-8.On the diagram below,Q represents the
Q224: When a country abandons a no-trade policy,adopts