Multiple Choice
Figure 9-22
The following diagram shows the domestic demand and domestic supply in a market.In addition,assume that the world price in this market is $40 per unit. 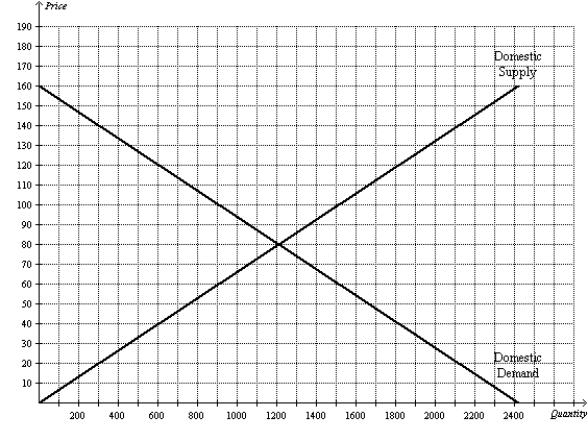
-Refer to Figure 9-22.Suppose the government imposes a tariff of $20 per unit.With trade and a tariff,consumer surplus is
A) $75,000 and producer surplus is $27,000.
B) $63,000 and producer surplus is $12,000.
C) $75,000 and producer surplus is $12,000.
D) $63,000 and producer surplus is $27,000.
Correct Answer:

Verified
Correct Answer:
Verified
Q1: Figure 9-4.The domestic country is Nicaragua. <img
Q2: Figure 9-16.The figure below illustrates a tariff.On
Q4: Figure 9-21<br>The following diagram shows the domestic
Q5: Figure 9-13 <img src="https://d2lvgg3v3hfg70.cloudfront.net/TB2297/.jpg" alt="Figure 9-13
Q6: Figure 9-20<br>The figure illustrates the market for
Q7: Tariffs and quotas are different in the
Q8: Suppose a country begins to allow international
Q9: Figure 9-23<br>The following diagram shows the domestic
Q10: Figure 9-20<br>The figure illustrates the market for
Q11: Figure 9-26<br>The diagram below illustrates the market